With the vast availability of data in the modern game, football data analytics is a specific job role within football clubs that is gaining importance & relevance in the modern era of the sport. Football data analysts crunch numbers & code on large and intricate data sets to bring to life visuals that can aid managers and coaches and help them make key decisions when it comes to tactics, player management & team performance.
Football data analysts now work within football clubs to provide interesting insights and analysis based on data, which further improves player performance & helps teams prepare whether it comes to their own players and the opposition come matchday.
One such area of football data analytics that shows how a player performs in front of goal throughout the season is a shot map.
What Is A Shot Map & How Is It Useful?
A shot map pinpoints every shot taken by a player over a set period of time along with its xG(expected goals) and the outcome of the shot. It helps a manager understand what kind of positions the player is finding himself in and how he reacts in a particular situation. Based on a dataset of a few matches a manager can give his players specific instructions to increase their chances of scoring goals.
How Is A Shot Map Made?
Shot maps are created by running a python code on a data set of shot data. Essentially, a football data analyst runs code over a specific player’s shot data set filtering the coordinates of each shot on an x & y plane, the outcome of the shot i.e. whether it was a miss, shot on target, or a goal, which body part the player shot with, and its xG, the latter of which shows the probability of the shot leading to a goal.
How To Analyse & Interpret A Shot Map?
A shot map is analysed in a plethora of ways after a football data analyst creates it.
Some of the ways of assessing a player’s shot map is to find out where the player takes most of his shots from, which area of the pitch is the player more likely to score from, in which positions the player was in when he scored more goals, from which side of the box and the pitch the goals came from and where he is most likely to get further goals from, and his xG per shot i.e. the higher likelihood of a shot hitting the back of the net.
These are just a few ways shot maps can be interpreted, they can further be used as models by managers to identify which positions a particular player should take up so that there is a higher probability of him scoring a goal or also from which area of the pitch should a player preferably move to in order to increase his chances of scoring.
Here we have two shot maps, one of Cristiano Ronaldo and the other of Mason Mount. As they play different positions we’ll highlight the differences between the two, and what they did well to each have a very successful season in front of goal.
Cristiano Ronaldo
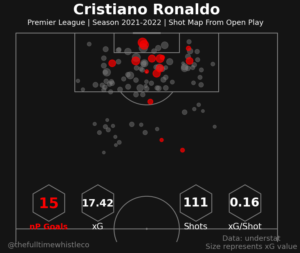
Widely regarded as one of the greatest of all time, Ronaldo had another brilliant campaign personally even if Manchester United had a season to forget. Ending the season with an impressive 18 goals(15 non-penalty goals) to his name. Only Salah and Son got more goals than him last season.
As we can see from his shot map, he takes most of his shots from inside the box. The red spots on the map are the goals and we see his effectiveness in front of the goal as he has scored from all across the box. We also see that he has scored with his left foot, and right foot as well as a few headers showing how complete he is as a striker.
Ronaldo also positions himself in such a way that when it’s time to shoot he is usually straight in front of the goal and has the entire goal to aim at. As we can see from his shot map most of his goals come from inside the width of the goal. The further a player is at an angle to the goal while shooting the tougher it gets to convert.
The only weakness, if we could call that, would be the shots from distance. Although he did score two goals from distance, it is clear that he is much more effective from inside the box. However, he has taken 22 shots from outside the box and has only scored two out of all of them. Nonetheless, in the modern era scoring two to three goals from outside the box is a fair return.
Mason Mount
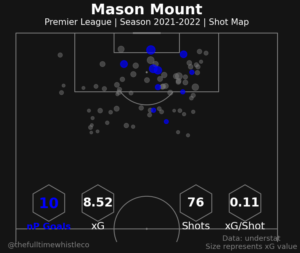
By far Chelsea’s player of the season, Mason Mount is delivering on the promise he showed early on in his career. With 11(10 nP goals) goals and 10 assists, he ended the season as one of only three players to end the season with double digits for goals and assists in the Premier League.
The thing that stands out the most about Mount’s shot map is his ability to score unlikely goals. Out of his 11 premier league goals, 8 had an xG under 0.5 which shows that Mount has exceptional finishing ability.
From his shot map, we can also see the areas he tended to occupy on the field. The right half of the box is much more shot-heavy than the left showing that he occupied the right half-spaces behind the striker and was more effective in scoring goals from the right. His favoured areas of scoring are from the right and centre of the box.
Apart from that, we notice his missed shots, none of them has an xG of over 0.3 showing that when given the opportunity to score he doesn’t tend to miss. Also, he has two goals from outside the box which is again a competitive return.
Learn Football Analytics On Mad About Sports
Do you want to create your own shot maps and other analytical charts analysing various aspects of football yourself?
Mad About Sports are facilitating a couple of pro-level courses that delve deep into football analytics.
The courses will get you up and running in the detailed world of football analytics and can help you create interesting charts and visuals after learning a bit of Python coding in just 2 days!
In the courses, you will learn how to convert available data and translate them into interesting visual charts, and it’s a great way to begin your immersive journey in football analytics.
Mad About Sports have a 2-day Workshop on Football Analytics & also a Football Analytics Masterclass, which can help you kickstart your journey into football analytics.
Click this link to register for the 2-day Football Analytics Workshop: https://s.madaboutsports.in/ftwfaw
Click this link to register for the Advanced Football Analytics Masterclass: https://s.madaboutsports.in/ftwfam
Sign up and begin your journey into football analytics immediately.
Register now!