Analytics

Mason Mount vs Europe’s Top 5 Leagues Attacking Midfielders/Wingers: Where Does Chelsea’s Mason Mount Rank Amongst Europe’s Elite?

This chart compares the percentile rank of Chelsea’s Mason Mount vs Attacking Midfielders/Wingers from Europe’s Top 5 Leagues. It’s been a productive season for the Chelsea academy graduate, who is slowly asserting himself into the Chelsea squad as a key player after his breakthrough season in 2019-20. Mount got double figures for both goals and […]
Read More

Trent Alexander-Arnold vs Reece James: Comparing Both England’s Young Right-Backs According To The Data – Premier League 2021-22 Season

This is a comparison of both England’s right-backs, namely Liverpool’s Trent Alexander-Arnold and Chelsea’s Reece James. Both full-backs have had exceptional seasons with their respective clubs. Liverpool won the FA Cup and Carabao Cup while Chelsea lifted the Club World Cup trophy. But who is the better option for the Three Lions according to the […]
Read More

Cristiano Ronaldo Shot Map From Open Play For Manchester United 2021-22

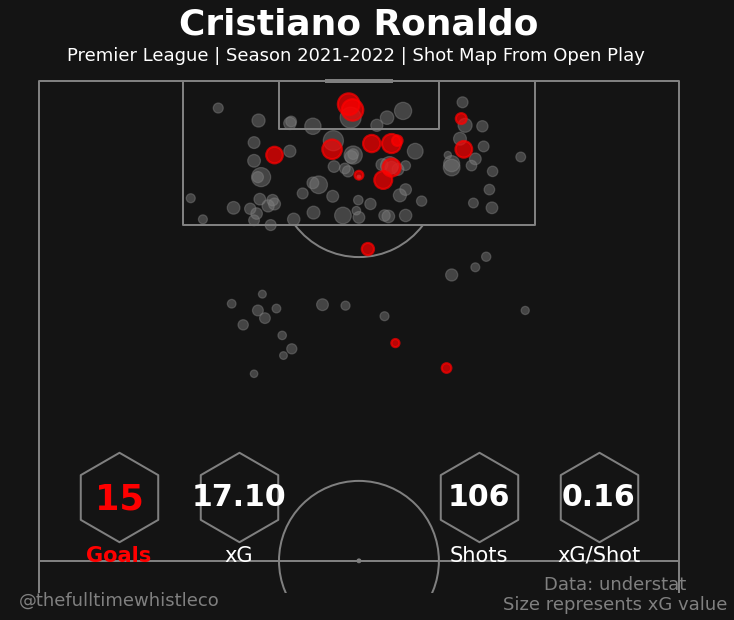
Here is Cristiano Ronaldo’s shot map from open play up until 36 games played in the Premier League for Manchester United in 2021-22. Ronaldo has taken a total of 106 shots and scored 15 goals from open play in the Premier League for the Red Devils so far this season. 12 of Ronaldo’s goals have […]
Read More

Explaining Expected Threat (xT) In Football Analytics Using Markov Models & Its History

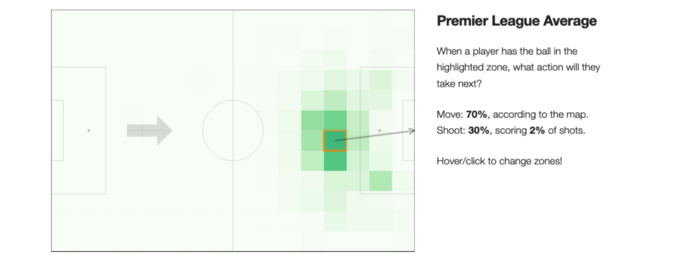
One of the most interesting upcoming areas of football analytics is Expected Threat or (xT). We’ve slowly become used to analytics data like xG(Expected Goals) and xA(Expected Assists) which allow us to predict and evaluate player performance. What Is Expected Threat? Expected Threat or xT evaluates the probability of scoring a goal based on the […]
Read More

Mason Mount Shot Map 2021 – 22 Season

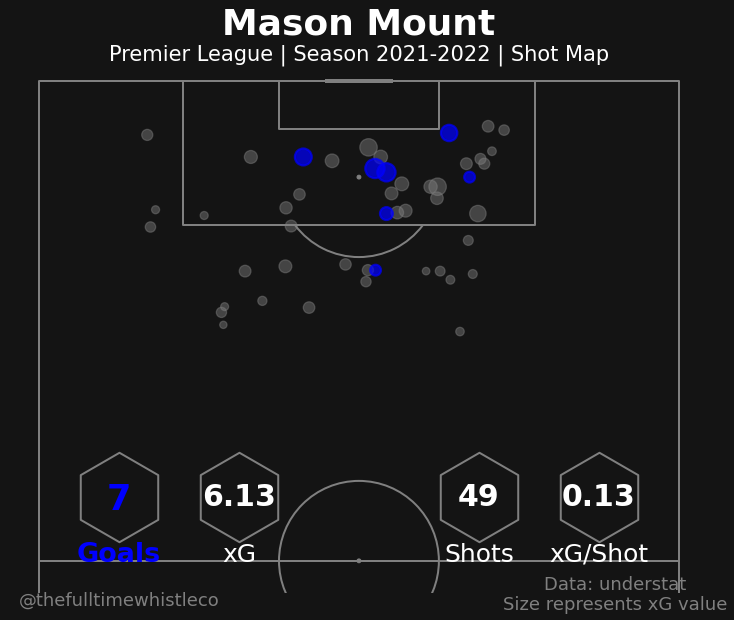
The following figure shows Mason Mount’s shot map data over the 2021/22 season. He has an xG of 6.13 and has exceeded it so far this season scoring 7 goals.
Read More

Manchester City’s Goals Scored(GF) vs Expected Goals Scored(xG) In The 2021-22 Season

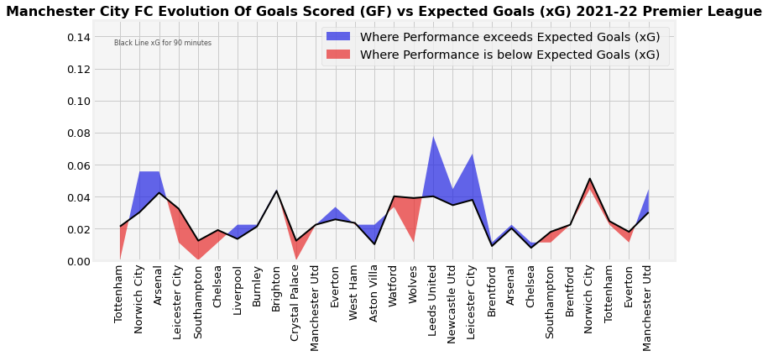
The following chart shows how current table toppers Man City have performed in front of goal, comparing their Expected Goals(xG) to their actual performance i.e. Goals Scored(GF) in all their Premier League games so far in the 2021-22 season
Read More

Man City’s Expected Goals Scored (xG) & Expected Goals Against (xGA) vs Goals Scored (GF) & Goals Against(GA) 2020-21 Season vs 2021-2022 Season

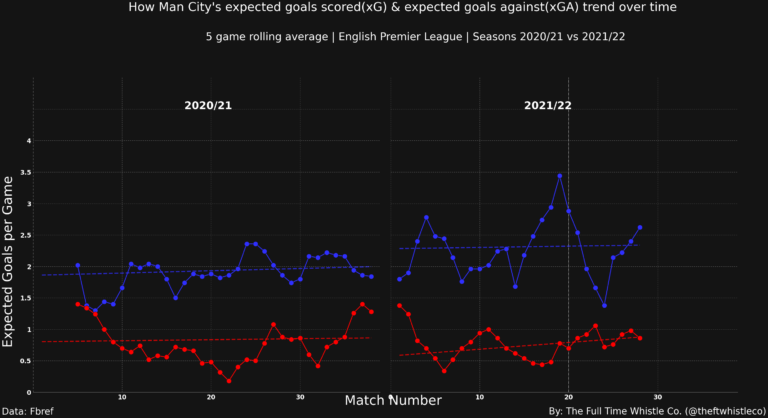
The above figure shows Man City’s Expected Goals xG(Blue) & Expected Goals Against xGA(Red) in the 2020/21 season vs the 2021/22 season. City have clearly upped their xG considerably to nearly 2.5 xG as an average in this 2021/22 season while their xGA has also reduced to under 0.8 xGA The figure above compares their […]
Read More

Goal & Shot Creation per 90 in Europe’s Top 5 Leagues so far in the 2021-22 season

Goal & Shot Creation per 90 in Europe’s Top 5 Leagues so far in the 2021-22 season Bayern Liverpool Real Madrid Chelsea Inter Top 5 leaders in productivity in front of goal so far this season Back after a break of a few months follow for more #football #stats
Read More

Charting Team Shot Creation Actions(SCA) and Goal Creation Actions(GCA) p90 in Europe’s top 5 leagues so far in the 2021-22 season

Charting Team Shot Creation Actions(SCA) and Goal Creation Actions(GCA) p90 in Europe’s top 5 leagues so far in the 2021-22 season Bayern Liverpool Real Madrid Chelsea Inter Rank highest in both Check where your team stands #football #stats #foootballstats
Read More

Reece James’ Shot Map so far in the @premierleague 2021-22 season

Reece James’ Shot Map so far in the @premierleague 2021-22 season 4 Goals 16 Shots 1.35 xG 0.19 xG/90 2.12 Shots/90 Lethal Follow my account @statocastgaurav for more stats #cfc #chelsea #chelseafc #premierleague #ReeceJames #goals #shotmap #football #stats
Read More